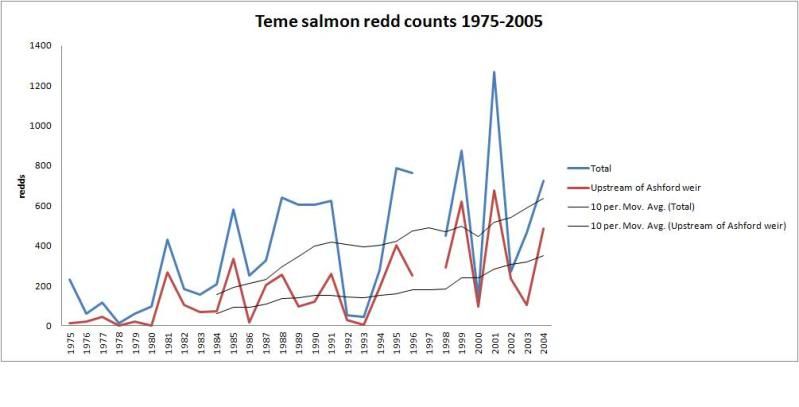
Printed below are graphs showing some information from the EA redd counts for the Teme from 1975 to 2004.
The picture they is entirely positive. It shows that stocks on one of the Severn's most important tributaries have been improving since the mid seventies.
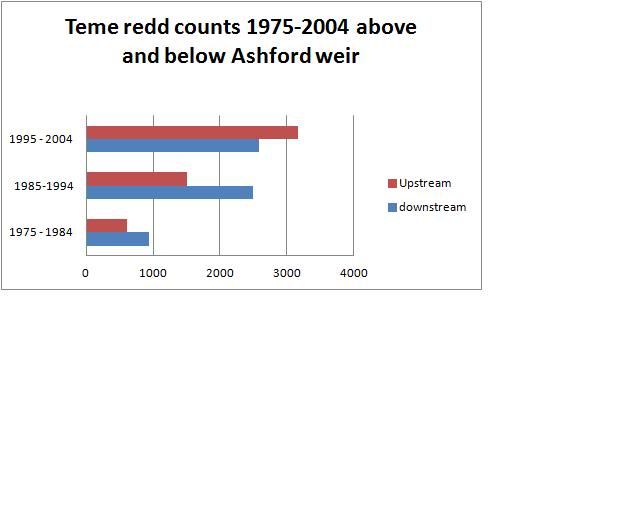
Over the last 30 years a considerable amount of work has been done to remove barriers to salmon migration on the Teme and tributaries. This has been followed through with pump-priming stocking. The result has been a substantial increase in the numbers of fish spawning above Ashford weir. The proportion of salmon spawning in the main river and tributaries above Ashford Weir has increased as has the total number of fish spawning in the river.
This pie chart shows the proportion of redds in each section of the system across the whole time period.

Since 2005 the EA have monitored salmon stocks on the Teme via the fish counter at Ashford weir. Last year this showed a run of over 2112 fish between October and January:
Teme fish counter figures winter 2010/11
Another 200 or so fish went through the counter in May and June so that gives a total figure of around 2300. The evidence from Redd counting tells us that this is far from all the total run as between 45% and 55% of Teme fish spawn below the weir - either in the main river or side streams. Checks on the accuracy of the fish counter by tallying what is counted going through the pass with what has been caught in the trap above, show that the data is reliable in terms of numbers and species.
However Teme salmon don't need to use the fish pass in high flows, so the count is always an under-estimate of the number of fish running to Ludlow and above.
The evidence from these redd count figures and the counter data raises an important issue. It suggests that the rod catch based calculations used nationally by the EA to estimate salmon populations is seriously underestimating the run of salmon on the Severn system and the health of the river.
The national EA use a stock assessment model, which takes the declared rod catch, assumes the same exploitation rate as they think applies on the Welsh Dee, and then comes up with a figure for the number of eggs deposited. On this basis they declare whether or not salmon stocks are healthy.
The other data collected by the EA contradicts this model. On the 2010 counter figures the Teme alone produced more eggs than the EA's model allows for the Severn as a whole.
So we have a choice: accept the conclusions of the EA's statistical 'black box' or think for ourselves. I can see no reason to ignore the Redd count and counter data and go for the outputs from the black box.
The problem we have as anglers is the weight given to the rod catch in the EA's statistical model. The counter figures also tell us that 85% of the teme run isn't getting to the middle river till after the season is over. While the other 15% are mainly running before bait fishing is allowed. And on most sections of the Teme bait is by far the best method. Things have been made even worse by the extreme low water conditons we've had over the last few seasons. The result is a very low rod catch that doesn't remotely represent the true picture of salmon runs on the Teme.
Rod catch should not be used in isolation from effort and changes to fishing methods. Nor should it be used without taking proper account of the angling culture and the extent of under-reporting of catches (which is still very high on the Severn). It should also be compared with other sources of data from counters and redd counts.
A rounded assessment shows that the Severn is far healtheir than the EA black box says it is.
The puzzle of the average weights in rod catches and the Teme counter
The official EA catch statistics tell us that in recent years 31% of Severn salmon in the rod catch weigh 8lb or less.
In contrast, the proportion of salmon of 8lb or less in the 2010 Teme fish counter figures is 61%. This is a bit of a puzzle. How can both sets of statistics be true?
The only explanation that appears credible to me is that there is a major run of grilse which in most years (without significant and repeated rises throughout the summer and early autumn) are not available to the rod fishery.
People not familiar with the Severn might be surprised to learn that there are 40+ miles of river above the estuary proper, but below the principal lower river fishery (Diglis weir at Worcester - just above the Teme mouth). This includes 15 or 16 miles of deep slow canalised river that is non- tidal on all but the highest of high spring tides. That is an awful lot of water for grilse entering the sytem in July, August, September and October to get lost in. Especially if they encounter low flows when they initially arrive. There is also the estuary for them to drop back to.
The idea that there is a significant late run of grilse fits with the facts as provided by the fish counters and places the Severn within the broad pattern of cycles shaping salmon populations in other rivers in the UK and Ireland.
No comments:
Post a Comment
Note: only a member of this blog may post a comment.